Marketing
Pathfinder

Turn interactions into insight

Customer journey analytics let you see which touchpoints attract, convert, and retain customers. Track contacts, deals, and tickets through every stage and measure conversion rates with precision.
A dynamic dashboard with customer journey analytics, showing colorful flowcharts and conversion rate reports for contacts, deals, and tickets.

Map and measure the customer journey.

Journey reports reveal how contacts and deals move across stages, showing where customers engage and where they drop off. Use insights to optimize touchpoints and accelerate growth.

Build reports your way

Short question goes here
  • Create journey reports from sample templates or start from scratch.
  • Measure journeys across contacts, deals, or tickets.
  • Add up to 15 stages and 15 steps with clear event tracking.
  • Analyze up to 5 years of data and 20 million unique events.
A dynamic dashboard visualizing customer journeys with conversion rates and touchpoint analytics, showing reports of contacts, deals, and tickets moving through stages.

Discover what really drives conversions

Short question goes here

Stage Analysis

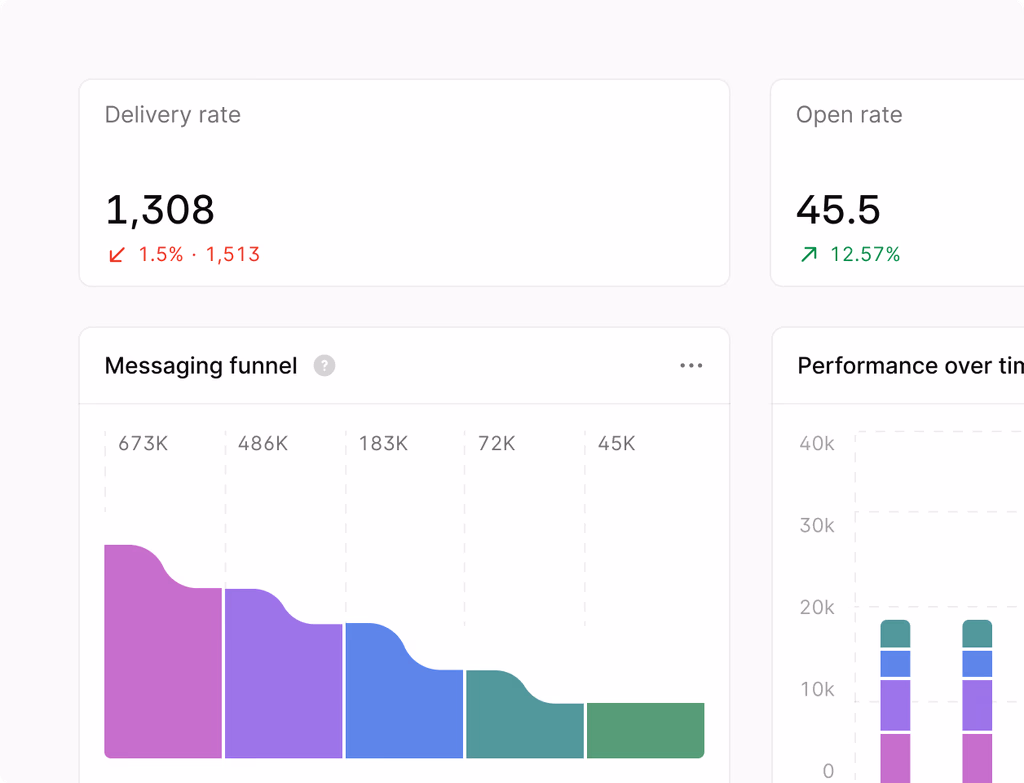
Identify which touchpoints generate the most conversions.

Top Events

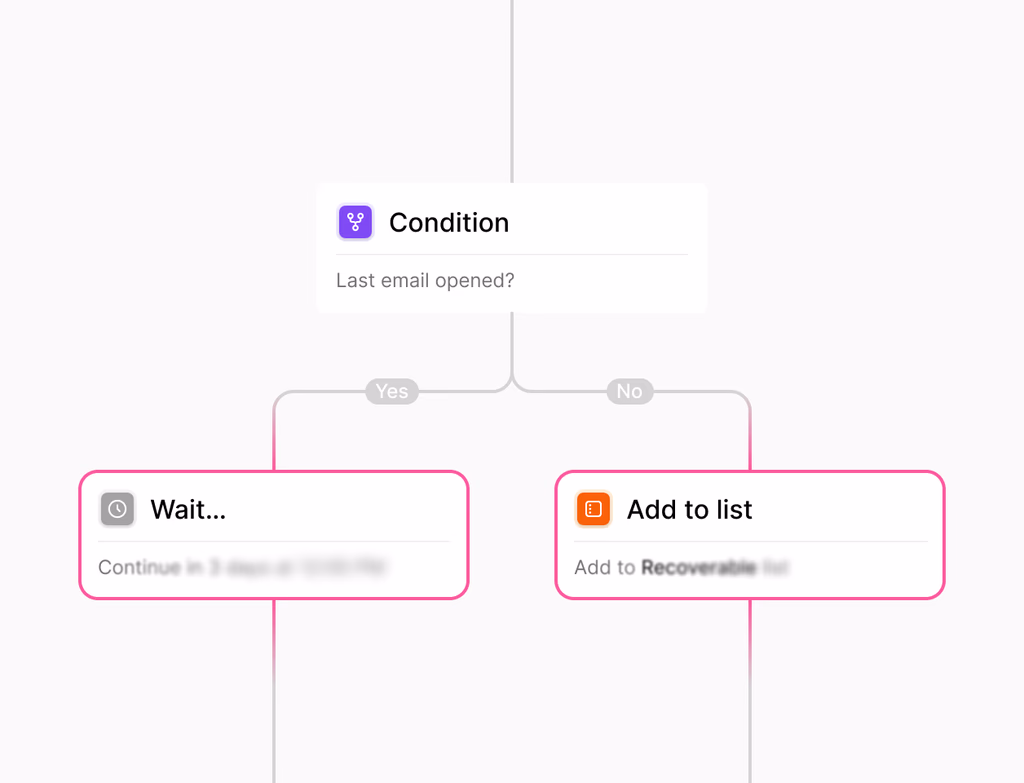
Highlight the most common actions customers take at each stage.

Conversion Paths

See how leads progress from visits to meetings and deals.

A dashboard showing conversion paths, key events at each stage, and touchpoint analysis to pinpoint what drives conversions.

Accelerate with Pathfinder (BETA)

Short question goes here

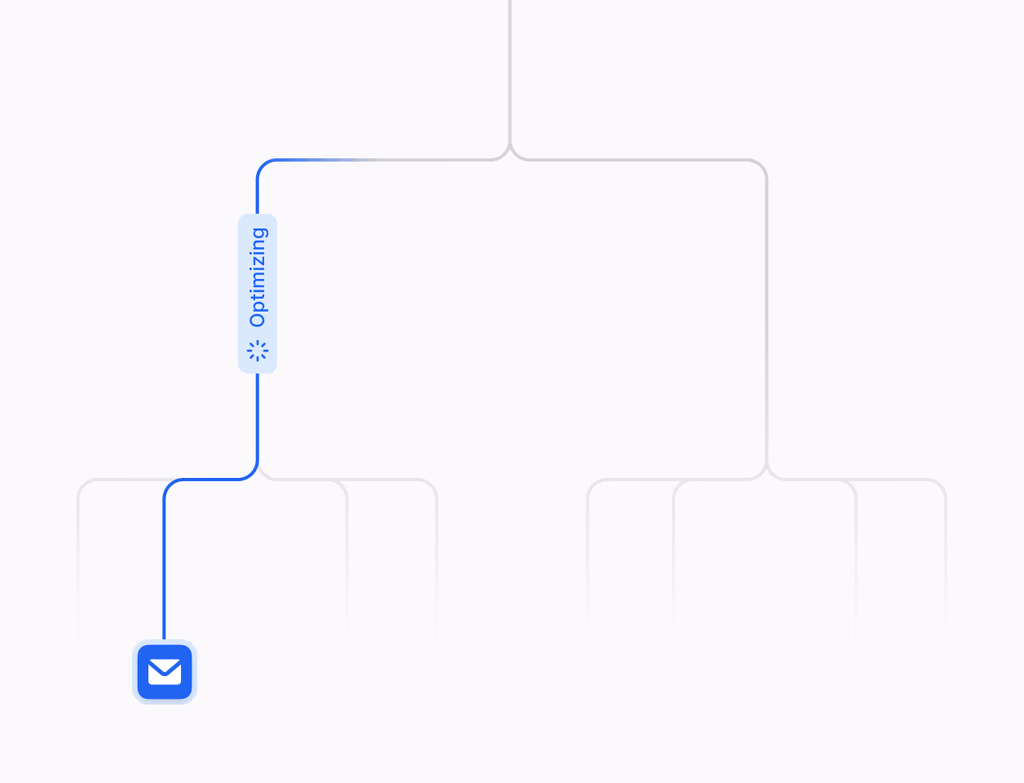
Use Pathfinder to automatically surface top paths before or after key outcomes. Let AI suggest stages, events, and milestones to speed up report creation and uncover hidden insights.

A dashboard showing AI-suggested customer paths, stages, and milestones for quick report creation and hidden insights.

Customize and act with confidence

Short question goes here
  • Apply filters by campaign, property, or event type.
  • Break down stages by properties like URL or form submission source.
  • Save and share reports across teams with set permissions.
  • Export data for deeper analysis or build static lists of up to 100,000 objects.
A customizable reports dashboard, with filters for campaigns and events, showing data breakdown and sharing options.

Have a question for our sales team?

Give us a call and we'll walk you through it.

Frequently asked questions

Short question goes here
Get started today

Ready to take Hoop for a spin?

It's Easy

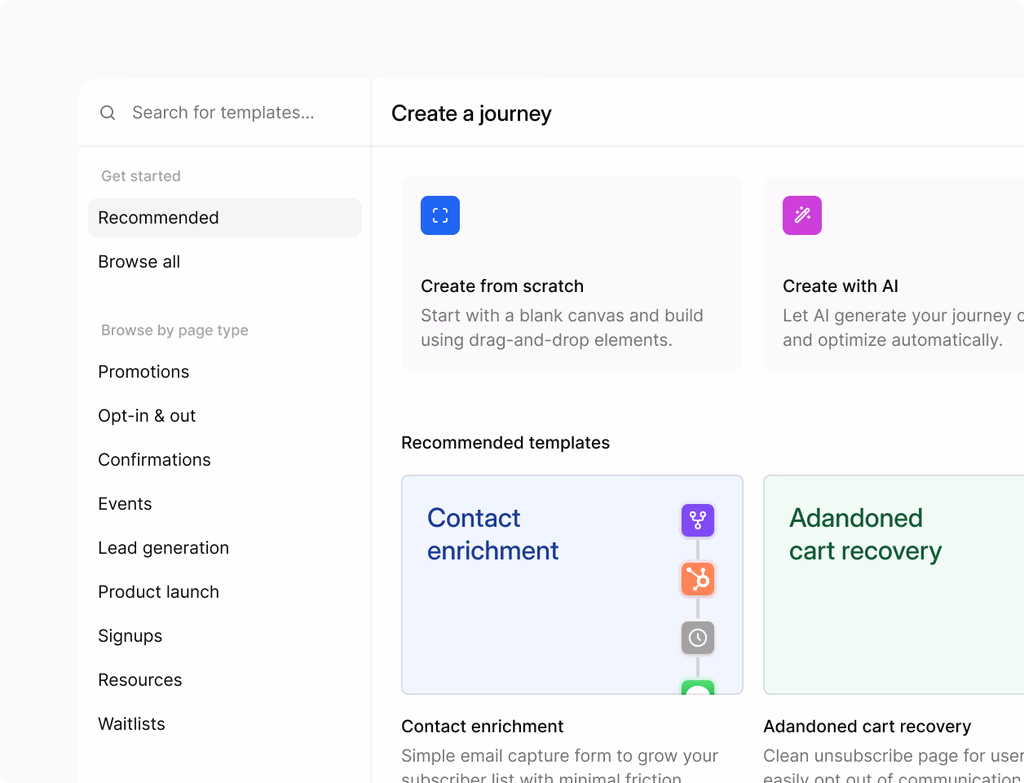
Customize your Hoop with intuitive onboarding, get tips for using it right alongside your tools, and let the Copilot automate work.

It's Fast

With powerful AI, tools, and automation built in, you’ll accomplish more in less time — without increasing headcount.

It's All in One

With all your software on one platform, you don’t have to stitch together multiple tools to get the job done.

Get started with
a 14-day free trial

5-star rating
4.9
from 12k+ reviews
Get started free
No credit card needed
Unlimited Usage
24/7 Priority Support
Cancel Anytime
1500+ Integrations