Which Hoop Marketing plans include the comprehensive analytics suite?
Core dashboards for key metrics are available across all Hoop tiers, ensuring every user can monitor basic performance immediately. However, advanced reporting features, especially multi-touch attribution and the custom report builder, are reserved for higher Hoop Marketing tiers.
Specifically, the enterprise plan offers the full suite of capabilities, including unlimited historical data retention and predictive analytics, which significantly enhance strategic decision-making. Users on the core plan receive essential dashboards, while the pro plan unlocks more detailed campaign and web analytics. This tiered approach ensures you pay for the level of analytical depth your marketing team requires to drive revenue.
How does Marketing Analytics manage data sources and integrations?
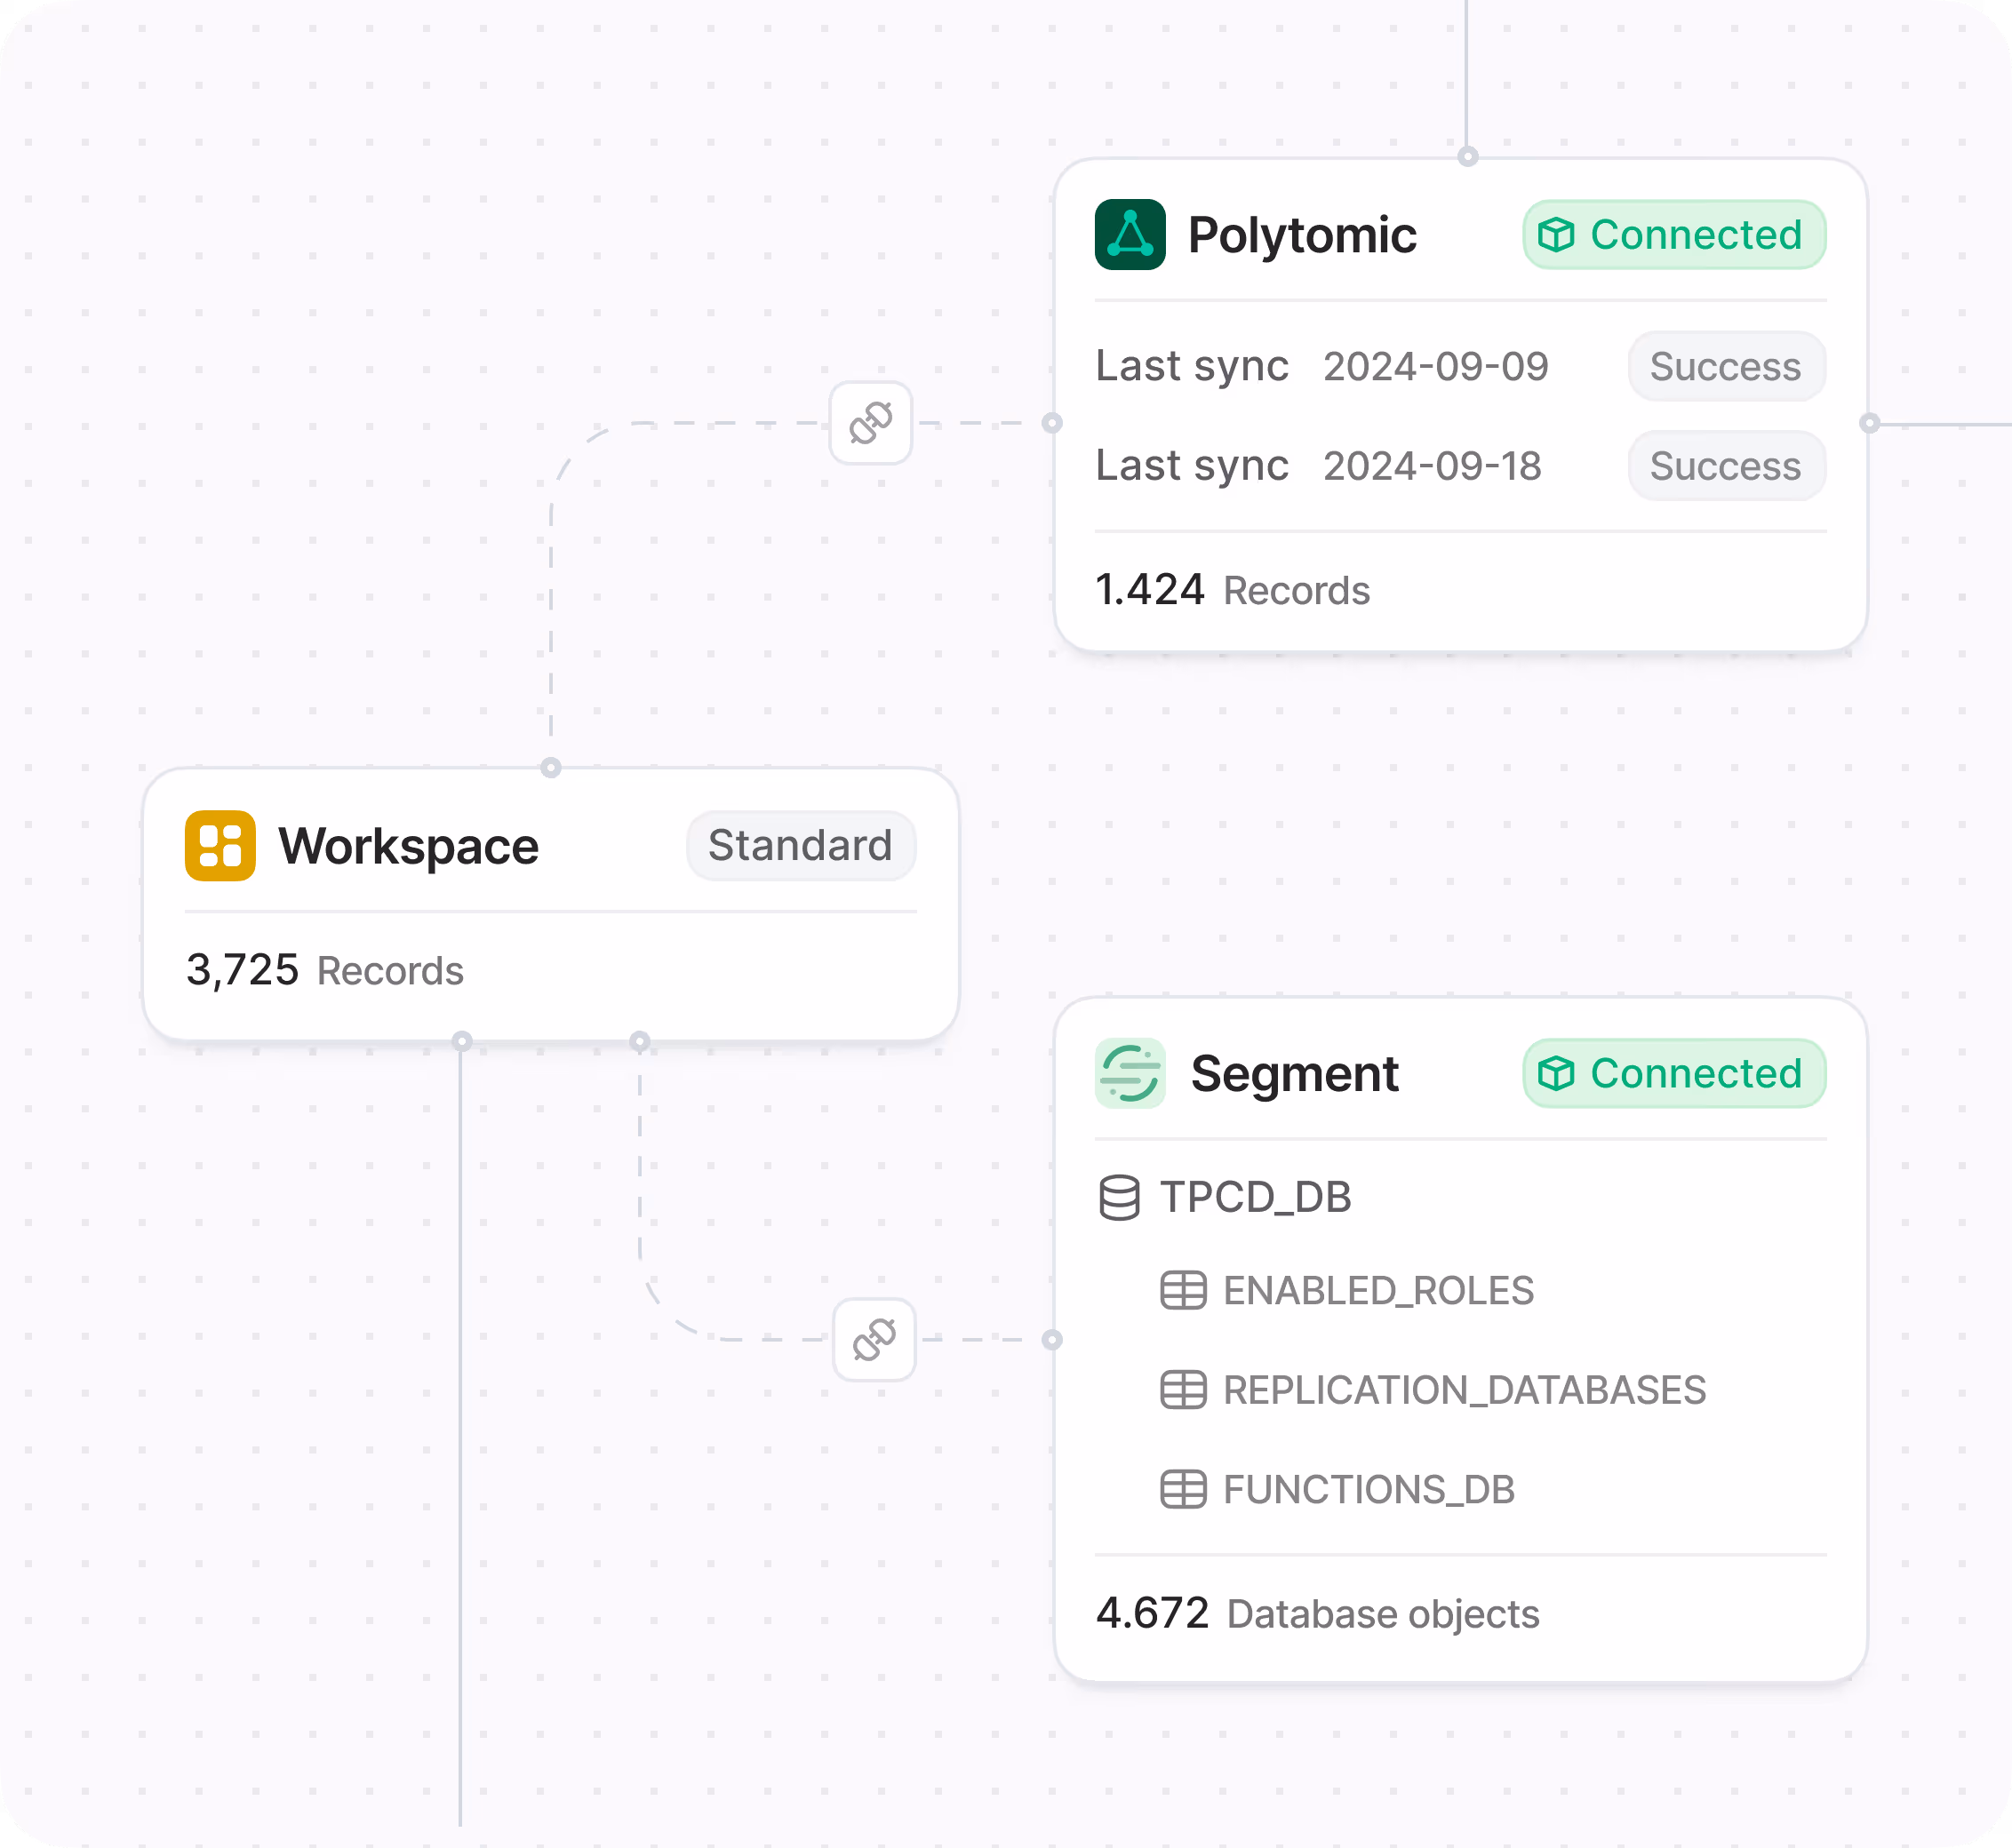
The Hoop platform is designed to consolidate marketing data from diverse sources into a single, unified analytics workspace. You can seamlessly bring in essential data without the complexity of manual stitching or separate tools.
This integration capability allows for true end-to-end visibility, connecting top-of-funnel activities to final revenue outcomes. Key data sources you can integrate and analyze include:
- Ad platform data (e.g., spend, impressions, clicks)
- Email marketing performance and engagement metrics
- Web analytics (sessions, pages, conversion rates)
- CRM and deal data for qualified pipeline tracking
This unified view is crucial for understanding the complete customer journey within Hoop.
Is it possible to build fully customized reports without needing SQL knowledge?
Yes, the Marketing Analytics feature includes a powerful custom report builder specifically designed for marketers, eliminating the need for SQL expertise. This tool allows you to go beyond the out-of-the-box dashboards and answer highly specific business questions.
You can combine various marketing objects, events, and filters to create tailored visualizations and datasets. The goal is to make advanced analysis accessible, enabling you to drill down into nuanced performance metrics. For example, you might create a report that:
- Compares cost and influence across specific campaign assets.
- Analyzes conversion rates segmented by device type and geography.
- Tracks the impact of individual content pieces on pipeline generation.
This flexibility ensures your reporting aligns perfectly with your marketing objectives.
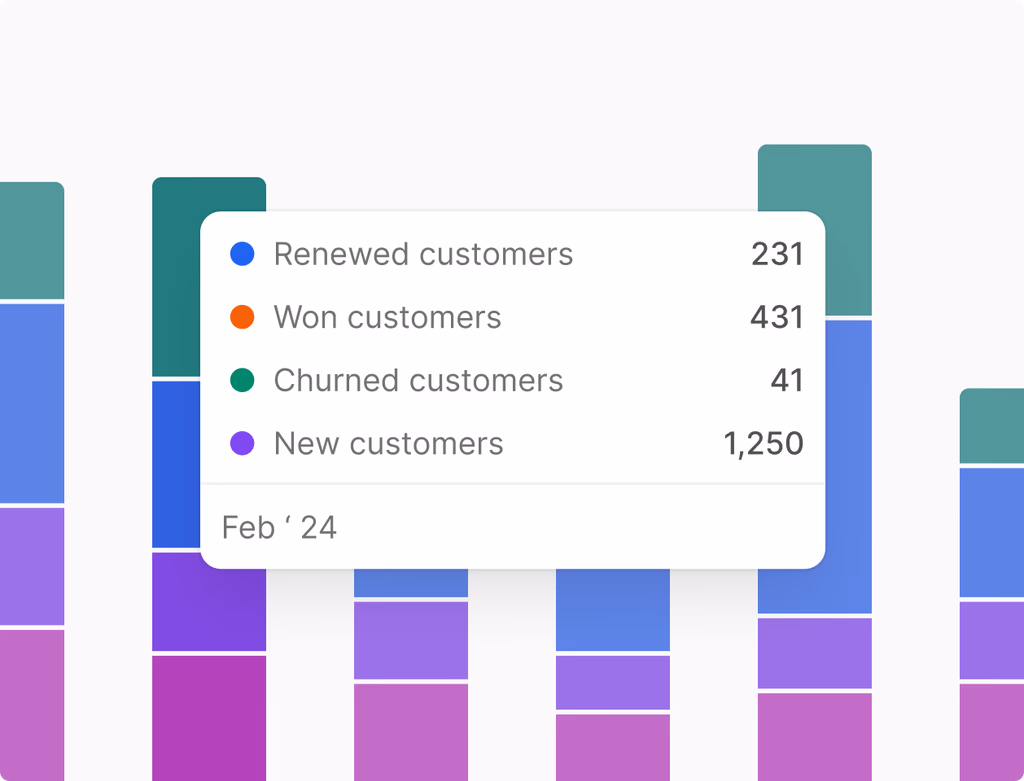
How does the platform handle multi-touch attribution for outcomes and revenue?
Hoop Marketing Analytics provides robust support for multi-touch attribution, which is essential for understanding the true value of every marketing effort. This goes beyond simple last-touch models to accurately credit all touchpoints leading to a conversion or revenue event.
By using multi-touch models, you gain a clearer picture of how channels assist conversions over time and which combinations are most effective in generating pipeline. The platform allows you to compare different attribution models—such as linear, time decay, or U-shaped—to see how they influence your outcome reporting. Layering lifecycle and deal data onto this framework provides full visibility into which activities generate qualified leads and, ultimately, revenue for your business.
What is the data freshness and sync cadence for marketing information?
The data in Hoop Marketing Analytics is maintained with a regular sync cadence to ensure decisions are based on the freshest possible information. Data from internal marketing activities, such as email and web tracking, typically syncs in near real-time. External integrations, including ad platform data and CRM records, sync on a set, frequent schedule.
Dashboards and reports reflect these updates promptly as they arrive, meaning you are viewing current performance trends, not stale numbers. The platform is engineered for high availability and low latency, so data is ready for analysis immediately after syncing. This reliable data freshness ensures you can react quickly to campaign performance changes and optimize budget allocation effectively within the Hoop system.
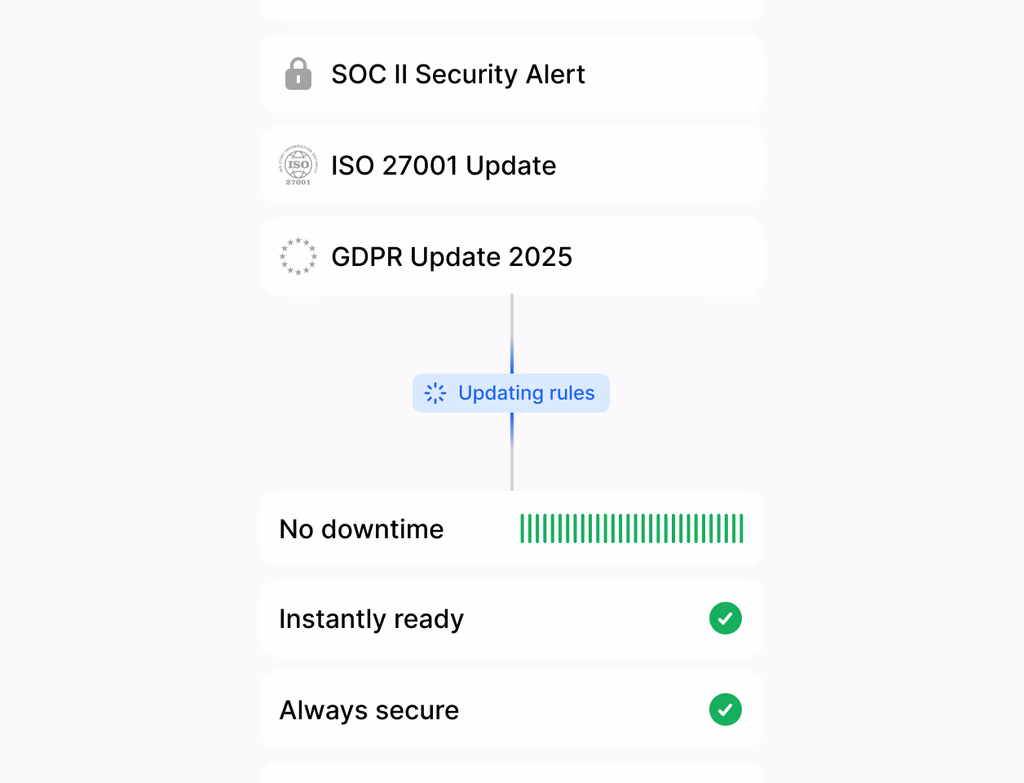
What security measures and data governance features are included?
Hoop prioritizes data security and governance within the Marketing Analytics feature. The platform employs role-based permissions, giving administrators precise control over who can view or edit sensitive reports and data sets. This ensures that only authorized personnel have access to performance metrics and customer data.
Furthermore, the system includes features to standardize definitions and filters. This is critical for data governance because it forces teams to align on a single source of truth, minimizing discrepancies and ensuring consistency as your organization scales. Standardized definitions are managed through shared filters and presets, promoting clarity and compliance across all reported metrics.
How quickly can a new team set up and see value from these analytics?
Onboarding for Hoop Marketing Analytics is fast and designed for quick time-to-value. Since core dashboards are immediately available, teams can begin tracking key performance indicators right away.
Initial setup typically involves connecting your primary data sources, which is expedited by out-of-the-box integrations for ad platforms, web properties, and CRM. Most teams are operational within a single day. You will immediately benefit from:
- Curated, pre-built views for campaigns, traffic, and funnels.
- Immediate visibility into campaign cost and outcomes.
- Drill-downs into web sessions and conversion rates.
The ability to instantly unify scattered data removes weeks of manual aggregation, allowing you to move from setup to strategic decisions quickly within the Hoop platform.