Content
Reporting Dashboards

See what content works.

See what content works.

Bring content performance into one place and understand which assets drive traffic, engagement, and revenue across channels.

A dashboard showing content performance metrics like traffic, engagement, and revenue for various content assets.
Content
Reporting Dashboards

See what content works.

See what content works.

Bring content performance into one place and understand which assets drive traffic, engagement, and revenue across channels.

Content
Reporting Dashboards

See what content works.

See what content works.

Bring content performance into one place and understand which assets drive traffic, engagement, and revenue across channels.
""

Make decisions with data your team trusts.

Short question goes here

Out-of-the-box dashboards highlight trends, while custom reports answer deeper questions about journeys, attribution, and ROI—no analyst bottlenecks.

Out-of-the-box insights

Short question goes here
  • Page and blog performance at a glance.
  • Top sources, conversions, and assisted influence.
  • Time on page, bounce, and form submissions for quick wins.
A dashboard showing content performance, traffic, engagement, and revenue across channels.

Custom reporting

Short question goes here

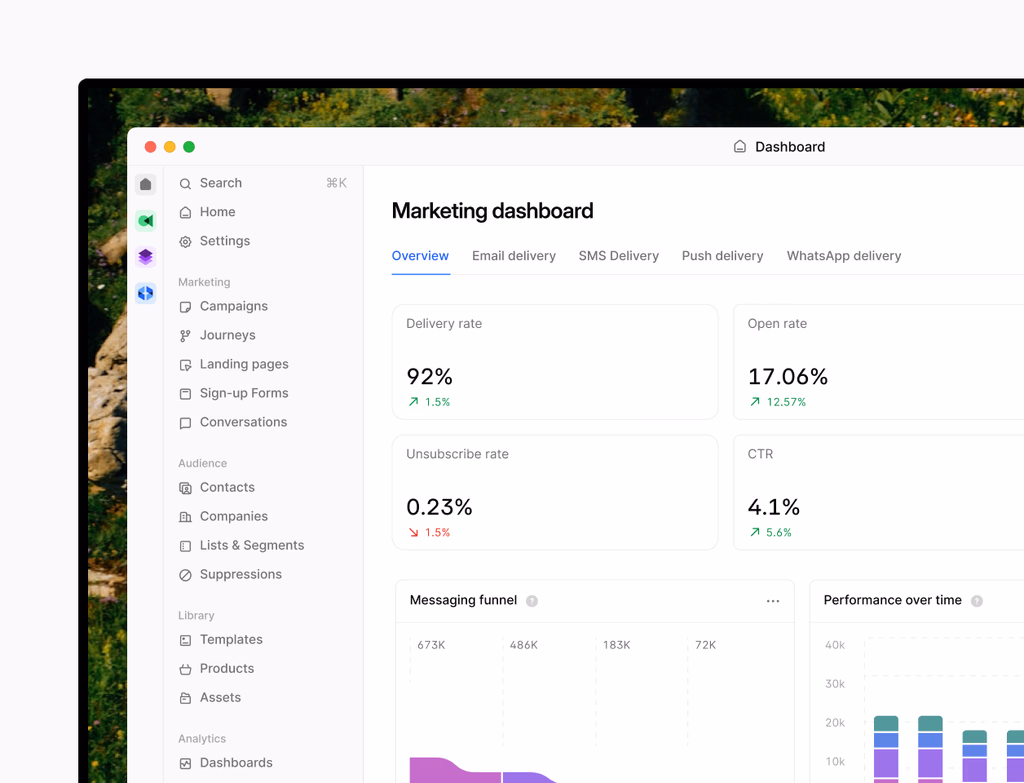
Build reports by topic, campaign, persona, or segment. Blend data from CRM, pages, and emails, then schedule updates and share securely with stakeholders.

A UI mockup showing custom reporting dashboards with various reports, data blends, and secure sharing options.

Journey and attribution

Short question goes here

Path analysis

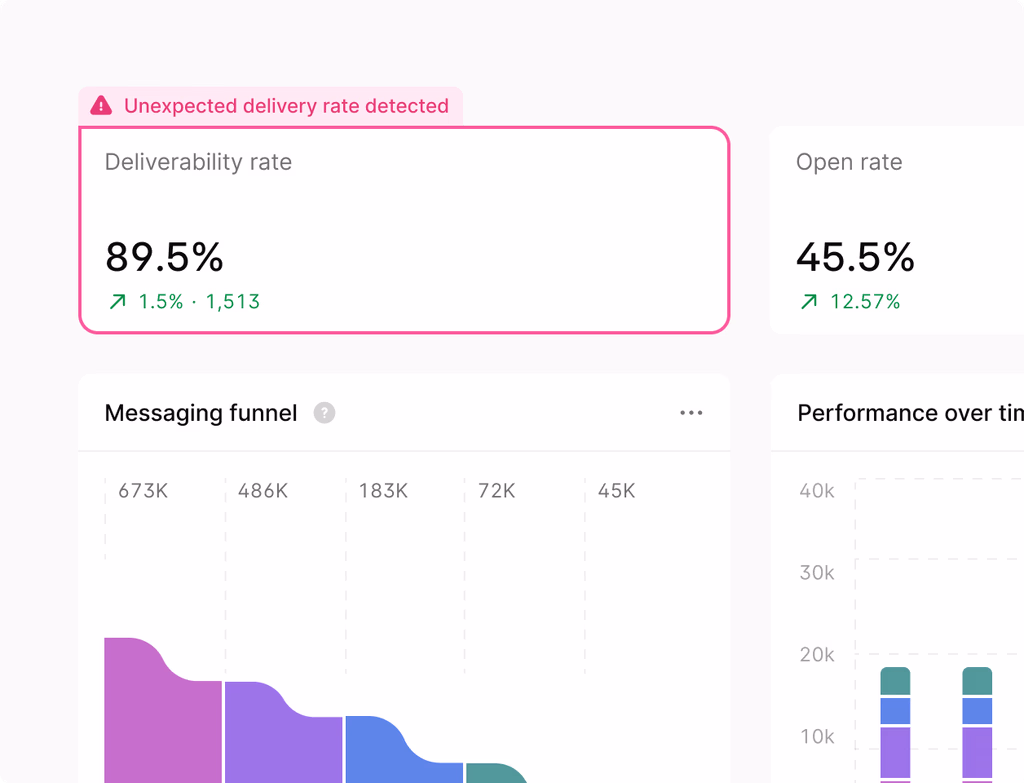
See the steps visitors take before they convert to identify high-impact sequences.

Multi-touch attribution

Understand which content assisted conversions across the funnel.

Budget optimization

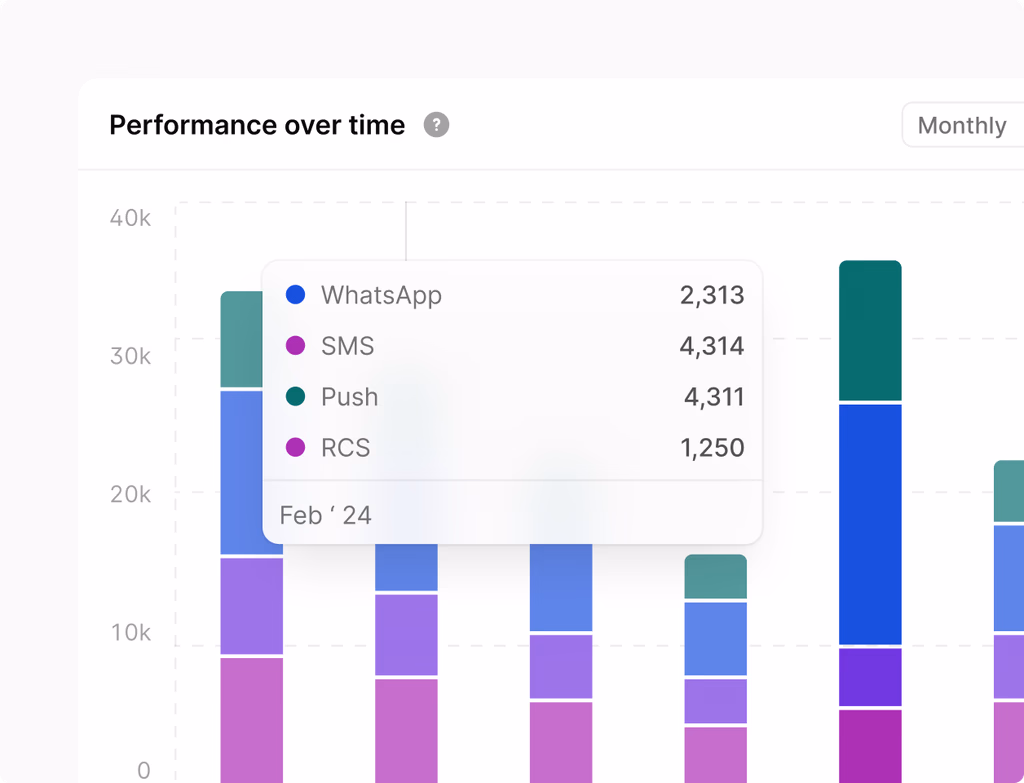
Reinvest in formats and topics that return value.

A dashboard showing user journey paths, conversion funnels, and content attribution alongside budget allocation charts.

Team-ready governance

Short question goes here
  • Dashboards per team with role-based access.
  • Annotations for launches and campaigns.
  • Templates to standardize reporting across teams.
A clean dashboard UI with team-specific views, showing annotations on charts and a template library for standardized reporting.

Have a question for our sales team?

Give us a call and we'll walk you through it.

Frequently asked questions

Short question goes here

Grow your business better

Get started with the all-in-one platform that’s easy to use and fast to drive results.