Can business users easily create new reports without technical help?
Yes, the Hoop Custom Report Builder is specifically designed for business users, not just analysts. The visual builder allows teams to easily join data objects like contacts, companies, and deals without needing to write complex queries. You simply use drag-and-drop fields and filters to build tailored reports.
This means your team can quickly answer their own questions and iterate on reports faster, moving from question to insight in minutes. This democratization of data ensures everyone can use analytics they trust and reduces bottlenecks that rely on technical resources.
How does the Custom Report Builder handle complex data combinations for analysis?
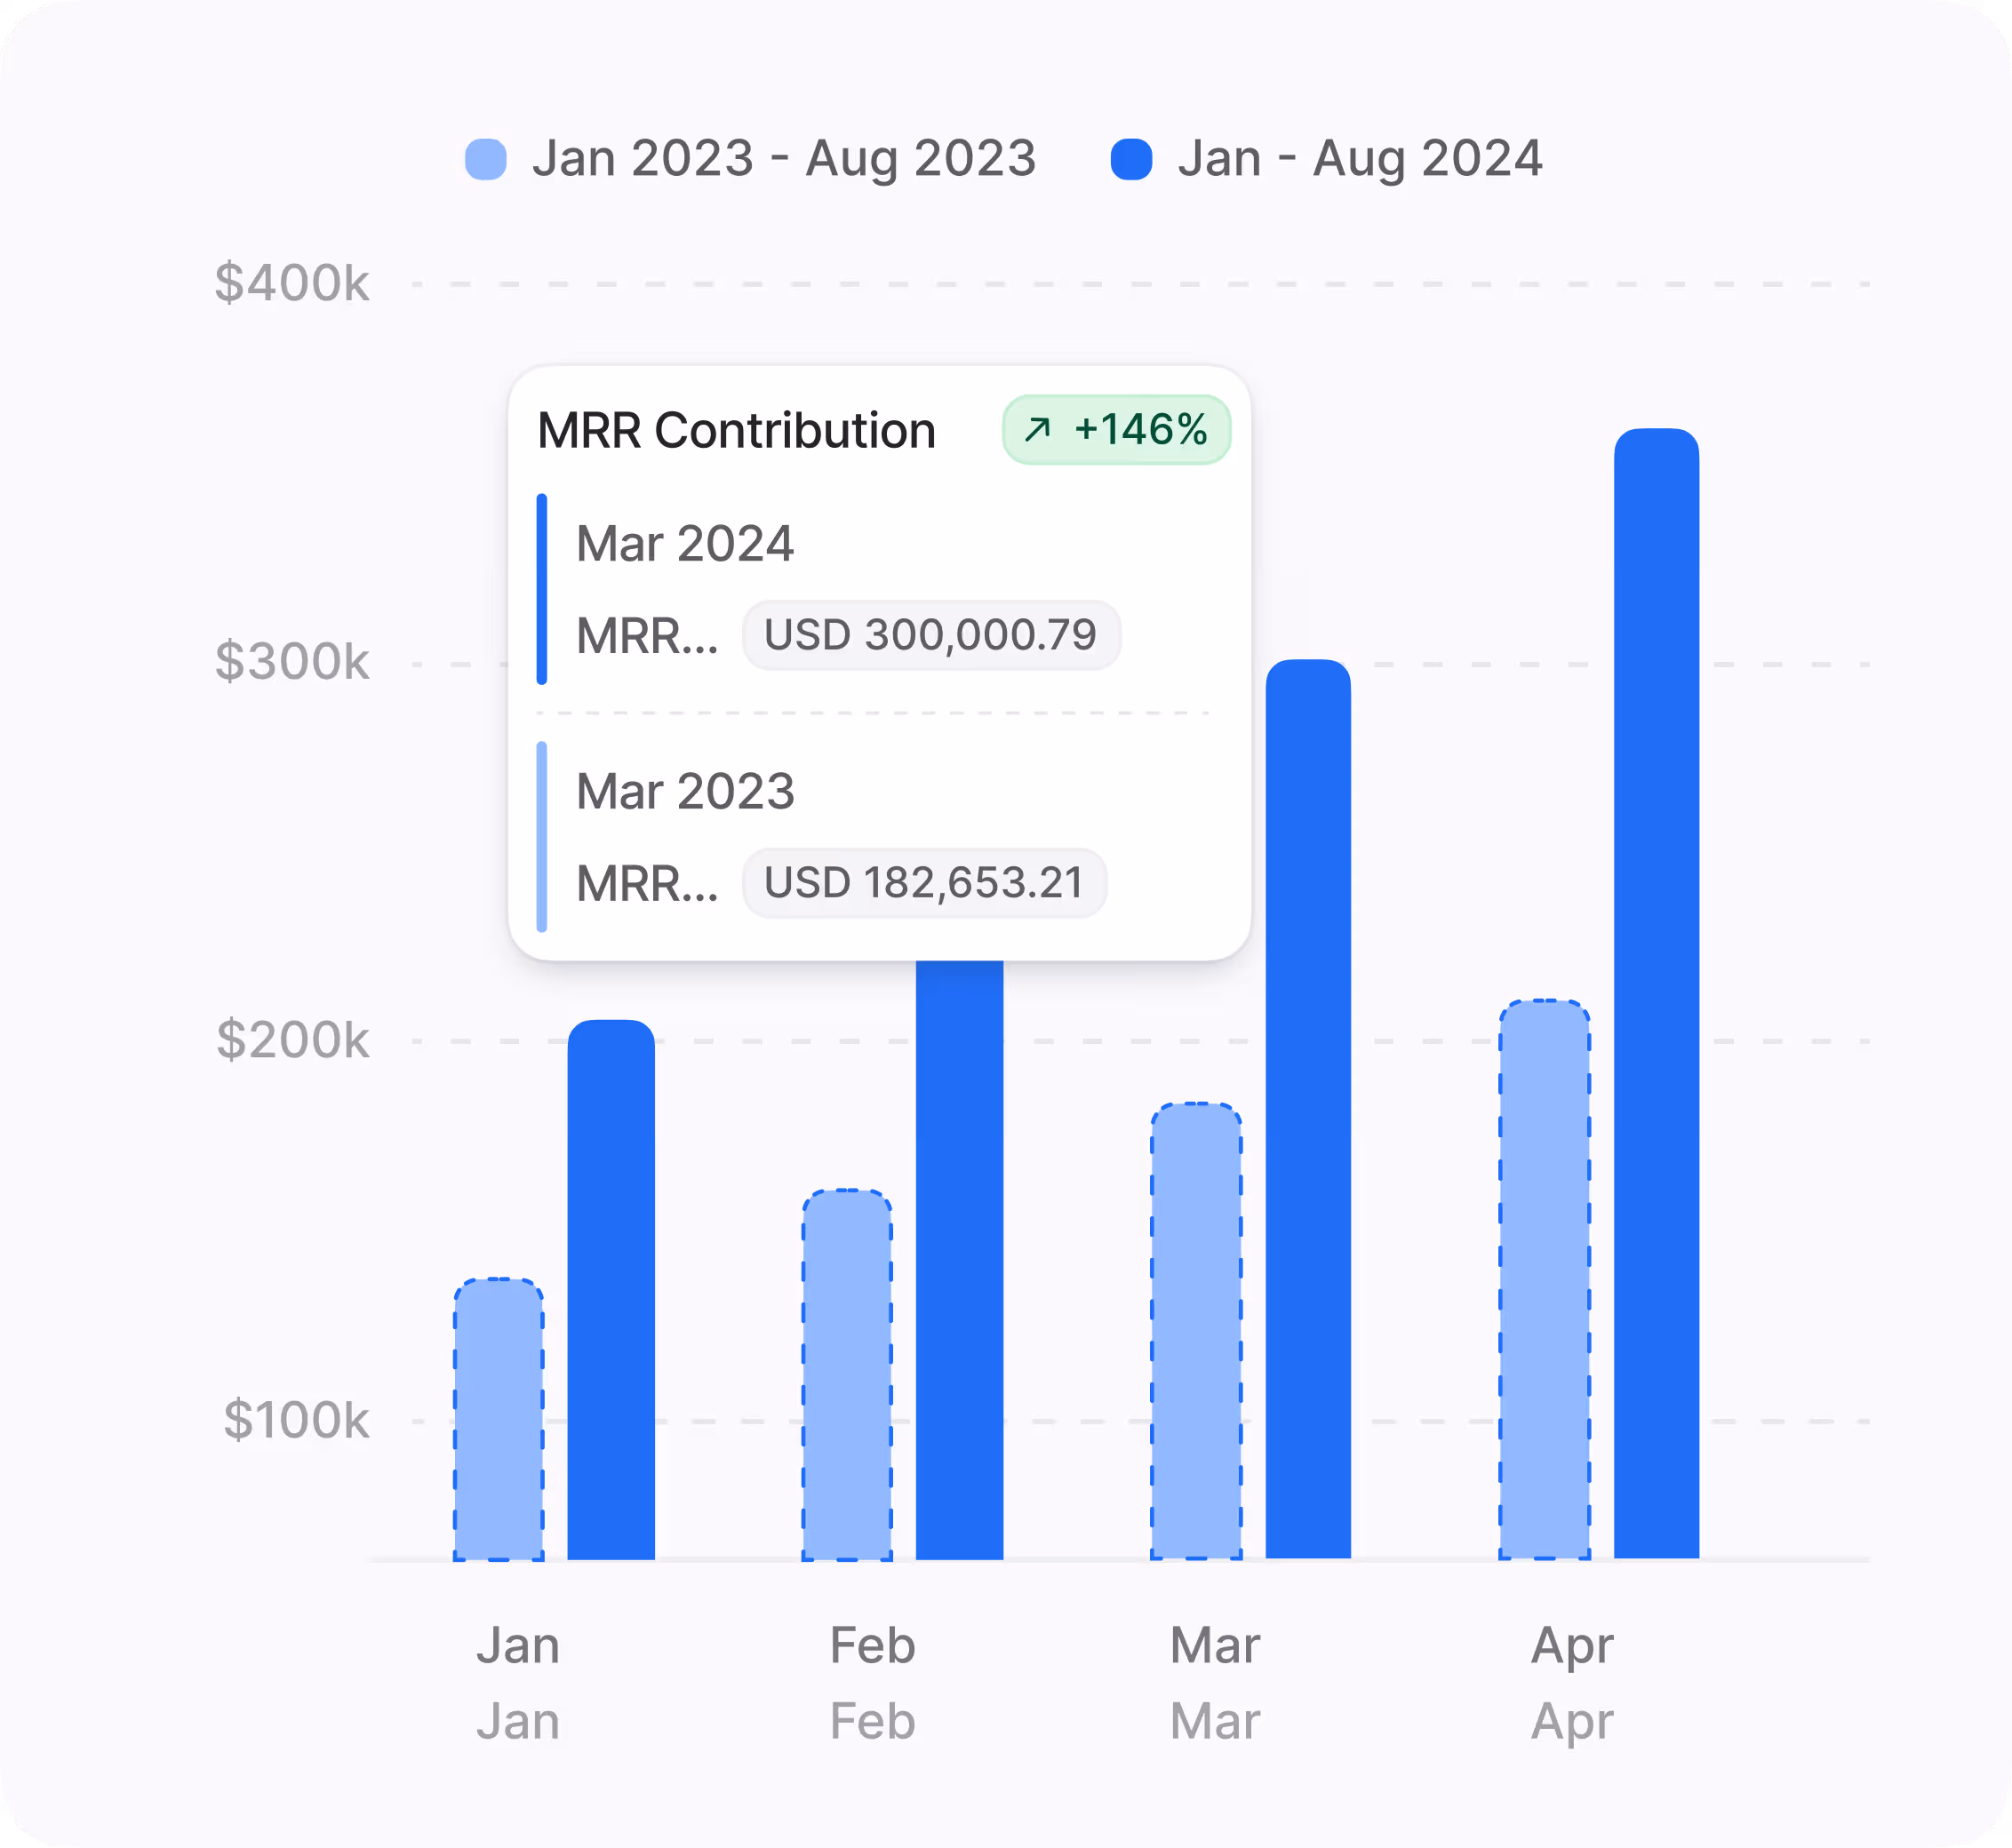
The Custom Report Builder excels at creating flexible datasets by allowing you to combine multiple objects and engagements within a single report. This capability goes beyond simple filtering to deliver deep, unified insights across your CRM data.
You can apply advanced logic to your data sets, which is crucial for modern analysis. Key functions include:
- Combining various objects and engagements into one view.
- Applying date logic and cohort windows for time-based analysis.
- Adding calculated and bucketed fields to create custom metrics.
These features help ensure the reports reflect the true complexity of your business operations.
What are the pricing plans and limits for using the Custom Report Builder on Hoop?
The Custom Report Builder feature is available across multiple pricing tiers on the Hoop platform, including the core, pro, and enterprise plans. Access to more advanced features, such as increased report complexity or the number of custom calculated fields, scales with the plan you choose.
For instance, while all plans allow for report creation, the enterprise tier generally offers greater scale optimization for very large datasets and higher limits on shared definitions and filters. This optimization ensures reports remain fast and reliable even with extensive data volume, making it suitable for growing organizations.
What visualization options are available for sharing and distributing reports?
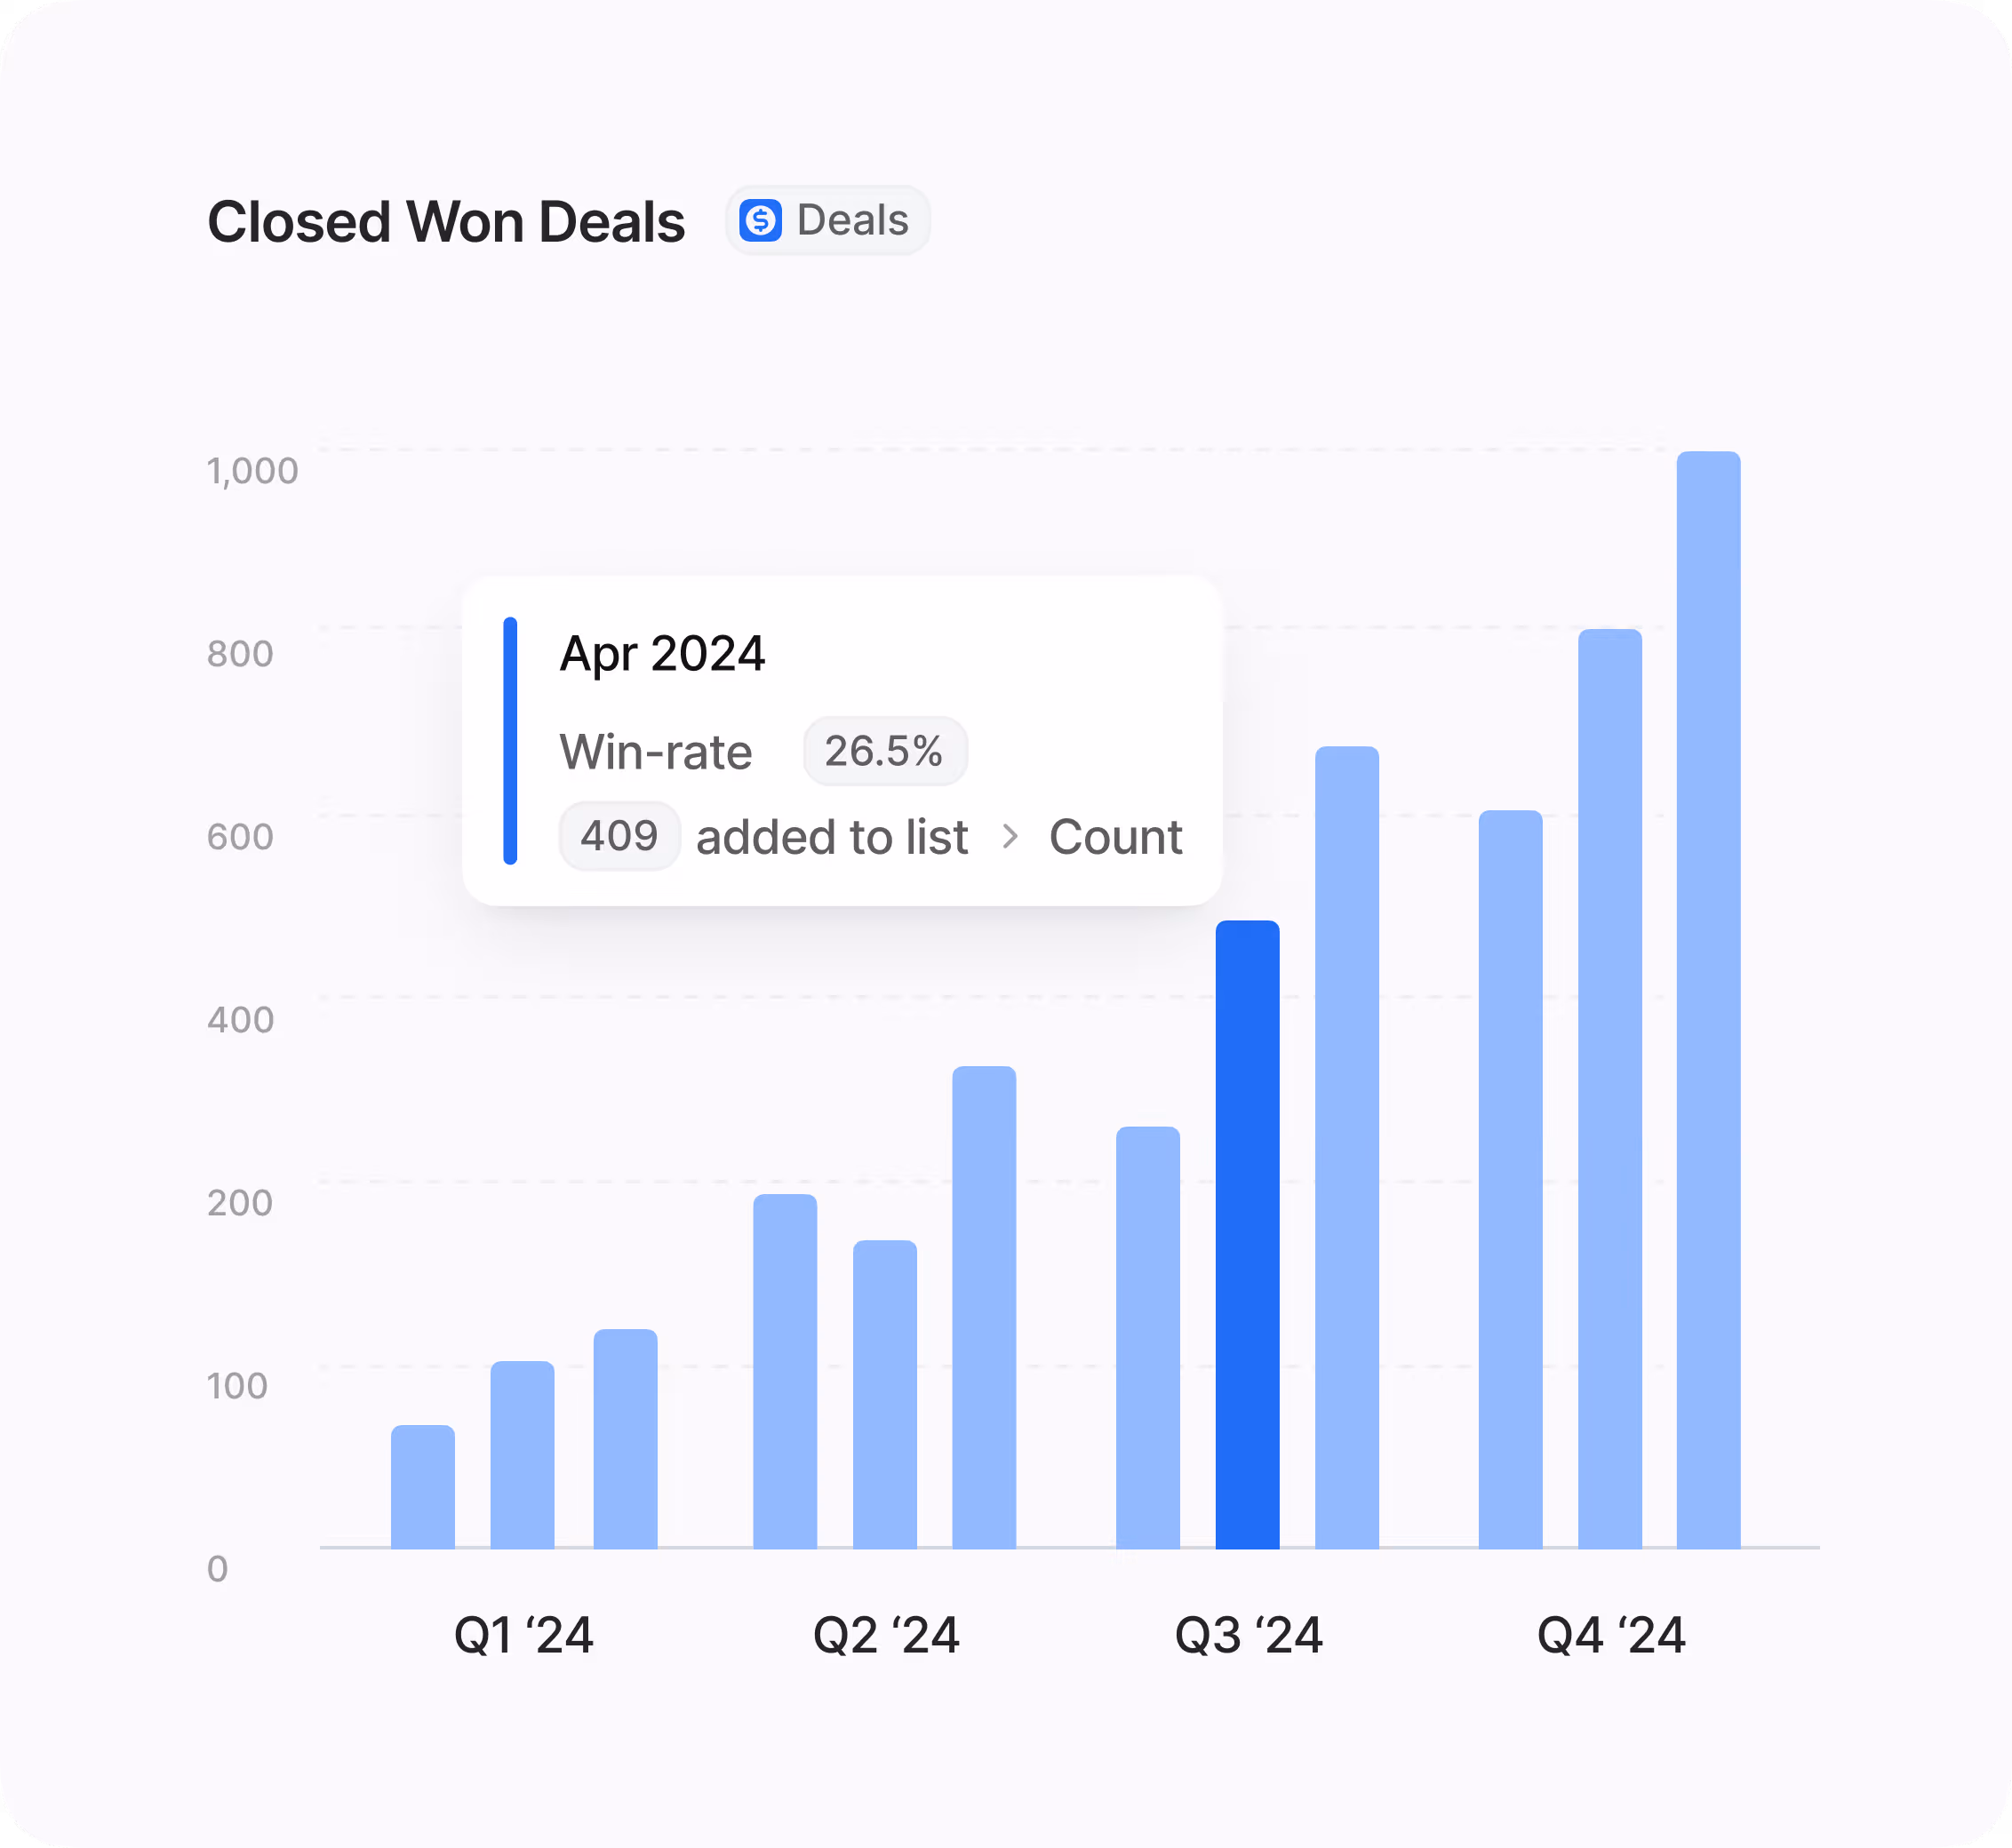
Hoop's Custom Report Builder provides extensive visualization options to help stakeholders understand the data quickly. You are not limited to basic tables; you can pick from several chart types to best represent your metrics.
Available chart options include:
- Bar, line, and area charts for time-series and comparisons.
- Funnel charts for tracking progression rates.
- Heatmap and other specialized charts.
After creating compelling visuals, you can group individual reports into comprehensive, role-specific dashboards. The platform also supports scheduling, allowing you to automatically email or embed dashboards for stakeholders to keep everyone informed with up-to-date data.
How quickly can we set up and start generating value from the new reports?
Setup for the Custom Report Builder is immediate since it is fully integrated into the Hoop platform. You can start building your first tailored report instantly by accessing the visual builder. The drag-and-drop interface and predefined objects mean there is virtually no time-to-value delay.
Value generation is accelerated through the ability to 'Build once and reuse.' By establishing clear definitions, filters, and access controls, you ensure consistency. This foundational work immediately provides analytics your teams can trust and eliminates the wasted time spent reconciling different versions of the truth across various spreadsheets.
How does the Custom Report Builder maintain data consistency across different teams?
The Custom Report Builder helps you govern definitions, which is essential for organizational alignment. It ensures that metrics mean the same thing across all teams and stakeholders within the Hoop platform, preventing confusion and data disputes.
You achieve consistency by utilizing shared properties and robust documentation. When a calculation or a key performance indicator is defined in one place, every report referencing it uses that exact definition. This unified approach provides:
- Shared properties for standardized data fields.
- Access controls to manage who can edit definitions.
- Documentation ensuring clear understanding of every metric.
This governance framework makes the analytics highly reliable for critical business decisions.