Commerce
Commerce Reporting Analytics Suite

Commerce Reporting Analytics Suite

Commerce Reporting Analytics Suite

Bring bookings, billings, and cash flow together with pipeline and engagement metrics. Leaders see what’s happening, why it’s happening, and what to do next—all inside the CRM.

A CRM dashboard showing reports for bookings, billings, cash flow, pipeline, and engagement metrics, all in one clear view.
Commerce
Commerce Reporting Analytics Suite

Commerce Reporting Analytics Suite

Commerce Reporting Analytics Suite

Bring bookings, billings, and cash flow together with pipeline and engagement metrics. Leaders see what’s happening, why it’s happening, and what to do next—all inside the CRM.

Commerce
Commerce Reporting Analytics Suite

Commerce Reporting Analytics Suite

Commerce Reporting Analytics Suite

Bring bookings, billings, and cash flow together with pipeline and engagement metrics. Leaders see what’s happening, why it’s happening, and what to do next—all inside the CRM.
""

Unified commerce analytics

Short question goes here

Blend object data across the lifecycle to analyze conversions from quote to paid. Standard models keep metrics consistent across teams and geographies.

Monitor key metrics

Short question goes here
  • Quotes sent vs. signed and time-to-sign trends.
  • Invoice status, aging, and write-off exposure.
  • MRR/ARR growth, churn, and expansion revenue.
A CRM dashboard displaying unified bookings, billings, cash flow, pipeline, and engagement reports for quick insights into business performance.

Customizable dashboards

Short question goes here

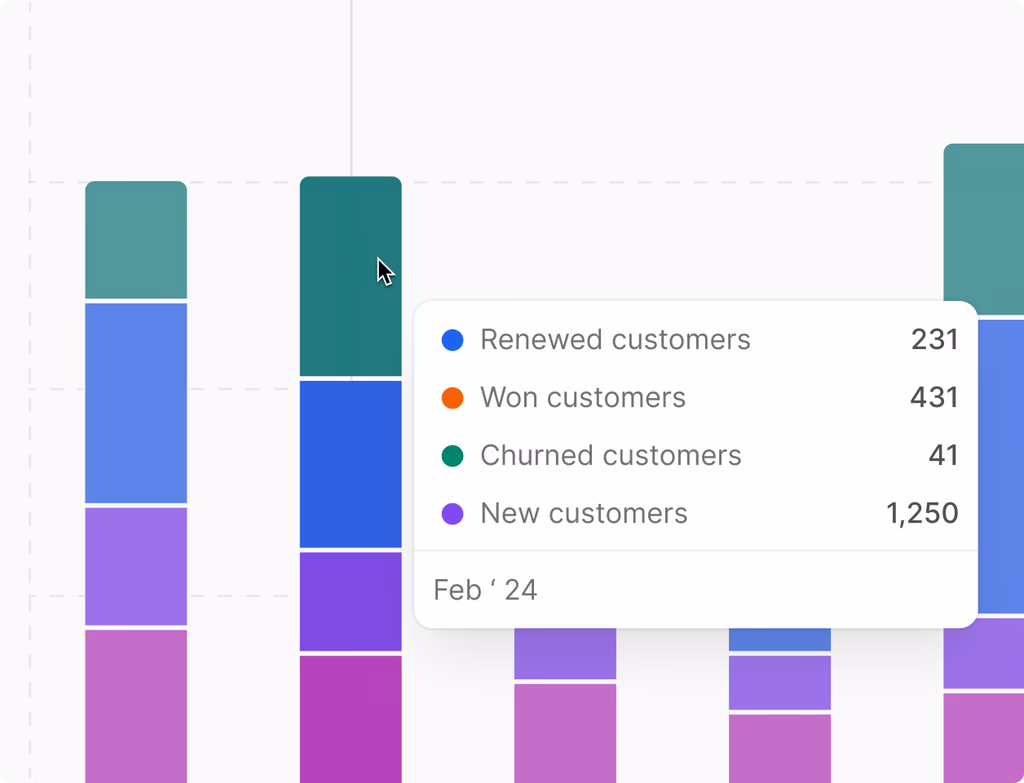
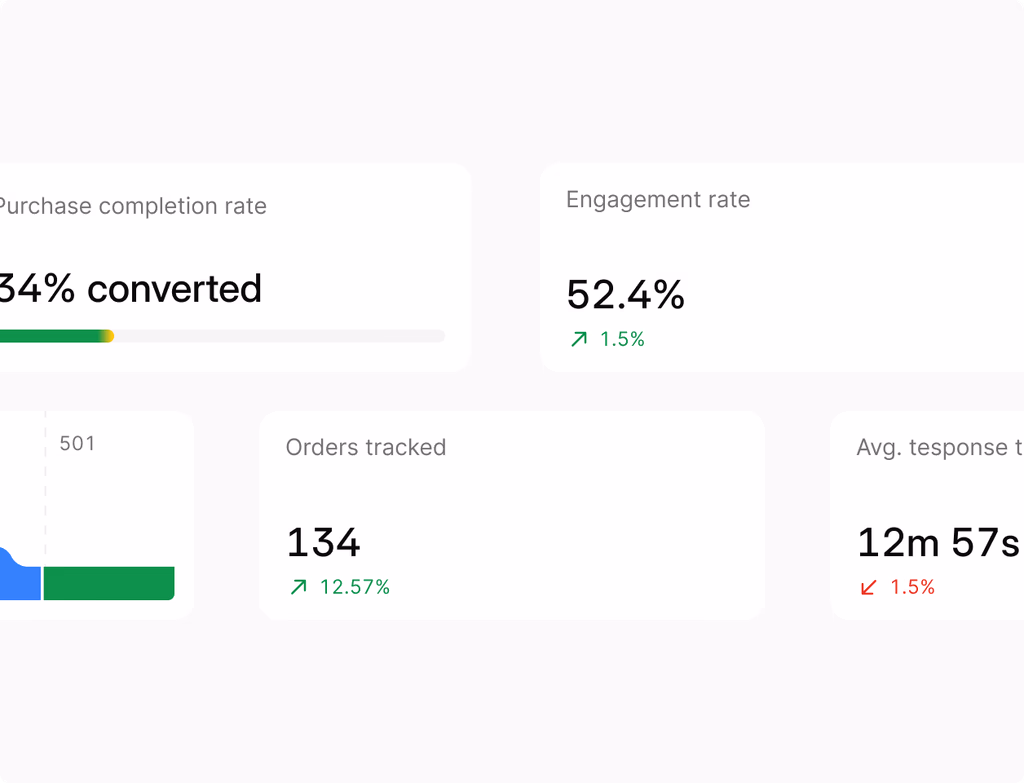
Start from curated boards, then add filters, cohorts, and comparisons. Save stakeholder views that mirror how each function measures success.

A UI mockup showing customizable dashboards with various charts, filters, and comparisons, reflecting different stakeholder views.

From insight to action

Short question goes here

Threshold alerts

Notify owners when KPIs slip or spike beyond targets.

Workflow triggers

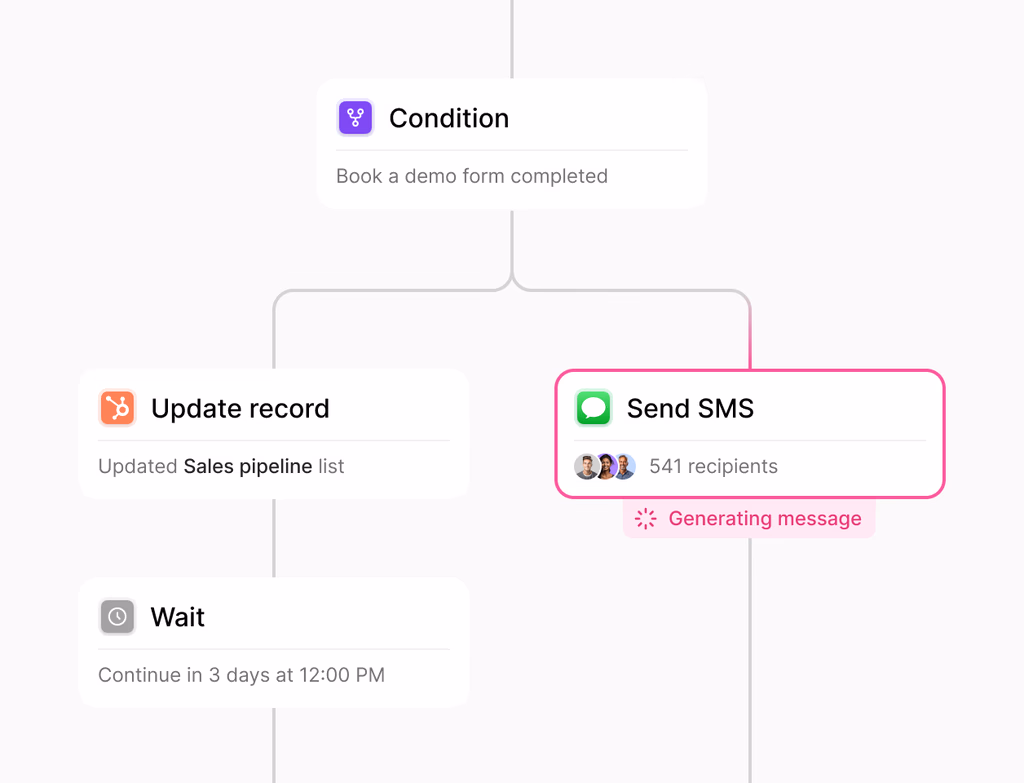
Launch tasks or nurtures when statuses change.

Annotations

Explain spikes with campaign and pricing notes for context.

A dashboard showing threshold alerts, workflow triggers, and annotations on charts, turning insights into action.

Revenue forecast support

Short question goes here
  • Connect probability, stage, and quote status to projections.
  • Model scenarios by discount and cycle time.
  • Drill into outliers to refine assumptions.
A dashboard showing revenue forecasts with adjustable probabilities, stages, and quote statuses, plus a detailed view of outliers for refinement.

Have a question for our sales team?

Give us a call and we'll walk you through it.
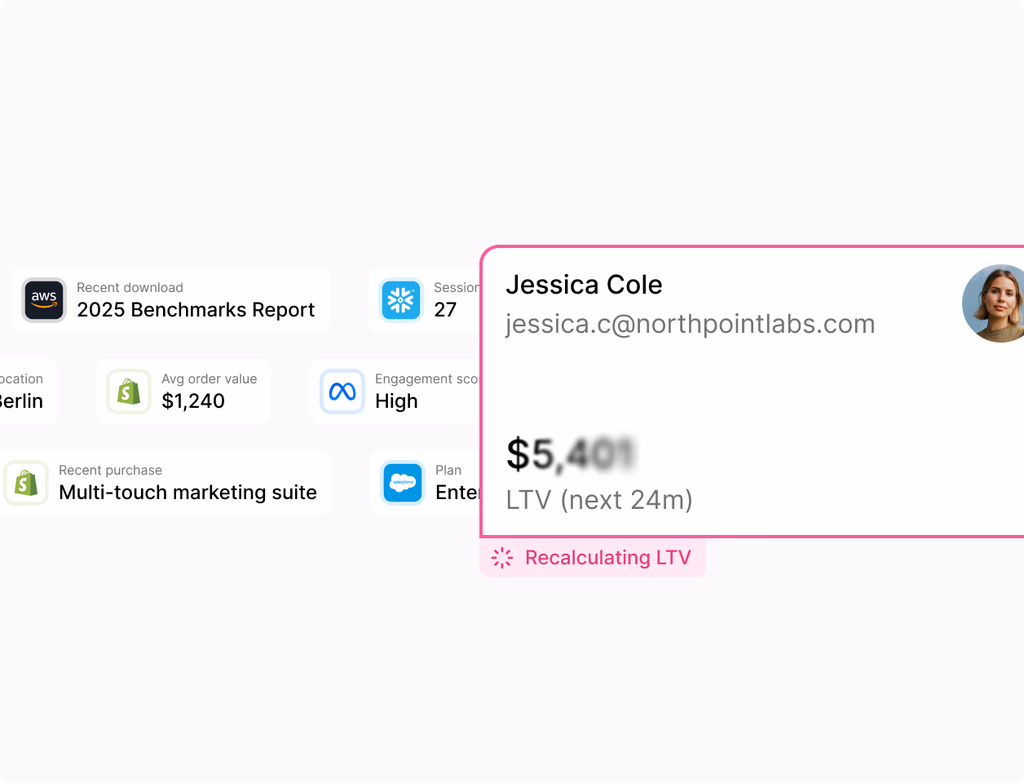
Frequently asked questions

Short question goes here

Grow your business better

Get started with the all-in-one platform that’s easy to use and fast to drive results.