What is Geographic Drilldown and who benefits from it?
Geographic Drilldown is a powerful feature within the Hoop platform that lets you analyze website traffic and demand beyond simple country totals. You can easily switch between Country, State, and City views to see precisely where your audience is located and where interest is growing fastest. This tool is essential for anyone responsible for marketing, sales, and operations, as it directly impacts budget allocation and campaign refinement.
Managers, marketers, and local businesses will find this feature most beneficial. It offers granular insights, allowing for hyper-targeted strategies based on real regional growth. If you manage budgets or refine campaigns, this tool ensures you focus resources where they matter most.
How does Geographic Drilldown reveal areas of high interest?
The feature works by combining an interactive map view with ranked lists, updating both in real time as you change levels from Country to State to City. This process immediately highlights high-interest geographic areas.
Key benefits include:
- Instant level switching via a single dropdown for real-time data refresh.
- Hover tooltips on any region show visitor counts for quick assessment.
- Ranked lists help you focus on the top-performing states or cities.
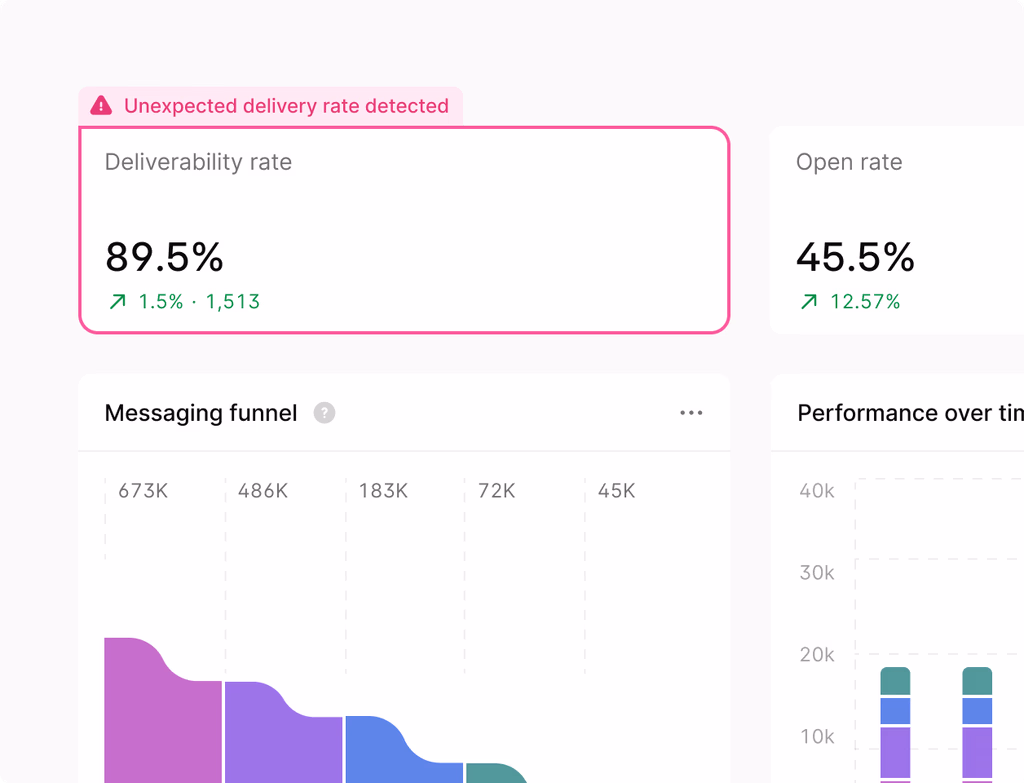
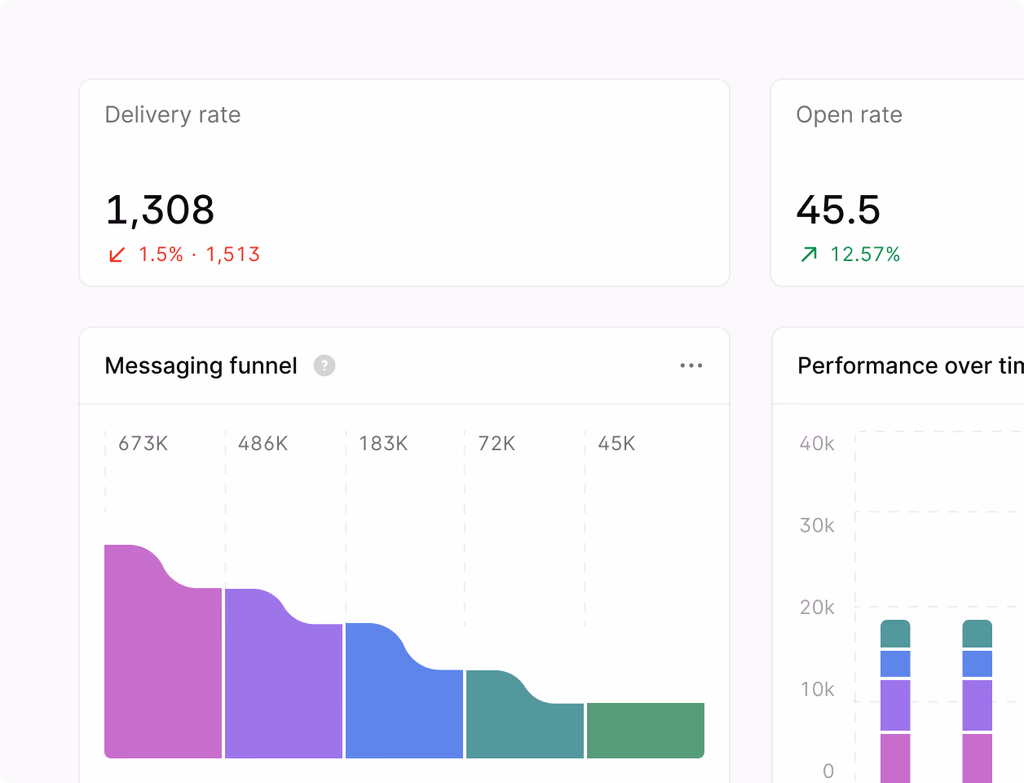
By making the total visitor count visible at all levels, the system maintains accurate summaries, allowing you to use these insights to allocate budgets more effectively on the Hoop platform.
Which Hoop platform plans include the Geographic Drilldown feature?
Geographic Drilldown is accessible across a wide range of Hoop platform subscriptions to ensure various business sizes can benefit from its regional insights. It is included in the core, pro, and enterprise pricing plans. The level of detail and access to advanced data exports may vary slightly between these tiers.
Specifically, all users get the core functionality, including the ability to switch levels and view ranked lists. Enterprise users typically gain access to more robust features, such as advanced exports via external tools like Data Studio and the full history of geographic data, optimizing reporting capabilities across their organization.
What is the typical time required to set up this new feature?
Integrating the Geographic Drilldown feature into your Hoop account requires minimal setup time because it uses data already being collected by the platform. You do not need a lengthy migration process or complex external connections to start.
Assuming your basic site analytics are already running on Hoop, the feature is immediately available within your dashboard, requiring no manual integration. Users simply navigate to the analytics section and select the 'Geographic Drilldown' view. This speed to insight means you can identify and act on high-demand regions within minutes of first using the tool, accelerating your time to value considerably.
Can I export data from the Geographic Drilldown view for reporting?
Yes, you can capture the regional insights displayed for external reporting purposes. While the primary view is designed for real-time analysis within Hoop, options exist for data transfer.
Here are the available methods for export:
- You can capture the on-screen view or insights directly for immediate reports.
- Advanced data exports are fully available through the integration with standard external tools.
- Enterprise-level customers can leverage API and webhook payload mapping for region-level analytics and reporting automation.
These exports allow you to easily integrate the platform's regional performance data into broader business intelligence dashboards.
Why does the City view sometimes exclude smaller towns and regions?
The coverage of the City view, including the granularity for smaller towns and regions, directly reflects the available data points collected. When visitor sample sizes for very small towns or regions are statistically low, the data may be aggregated to the next highest level.
To ensure meaningful and accurate analysis, the platform prioritizes data quality. If you find the City view lacking specific granular detail due to low sample sizes, you should switch to the State view. This broader perspective provides a more reliable dataset for refining campaigns and regional reporting when facing lower visitor numbers in specific micro-locations.
How frequently does the geographic heatmap and ranked list update?
The map visualizations, including the geographic heatmap, and the ranked lists update with high frequency to give you the most current view of visitor activity. They refresh continuously as new visits and traffic data are successfully processed by the Hoop platform.
The system is designed for near real-time performance to ensure that decisions based on the Geographic Drilldown are timely and relevant. This continuous updating allows managers to quickly track the impact of ongoing regional campaigns and double down on areas where regional growth is strongest without significant lag between visitor activity and reporting.